Vol. 1, No. 5
The Cost of Capital for December 2021, Private Credit and Why Employment Bounced Back, Stock Valuation Rundowns, and a Deep Dive Into My Best idea.
Welcome to Valuabl - a fortnightly newsletter for value investors with deep dives into my best ideas.
In Today’s Issue:
The Cost of Capital: December 2021 (1 minute)
Private Credit and Why Employment Bounced Back (5 minutes)
Stock Valuation Rundowns (2 minutes)
Deep Dive Into My Best Idea (12 minutes)
1/ The Cost of Capital: December 2021
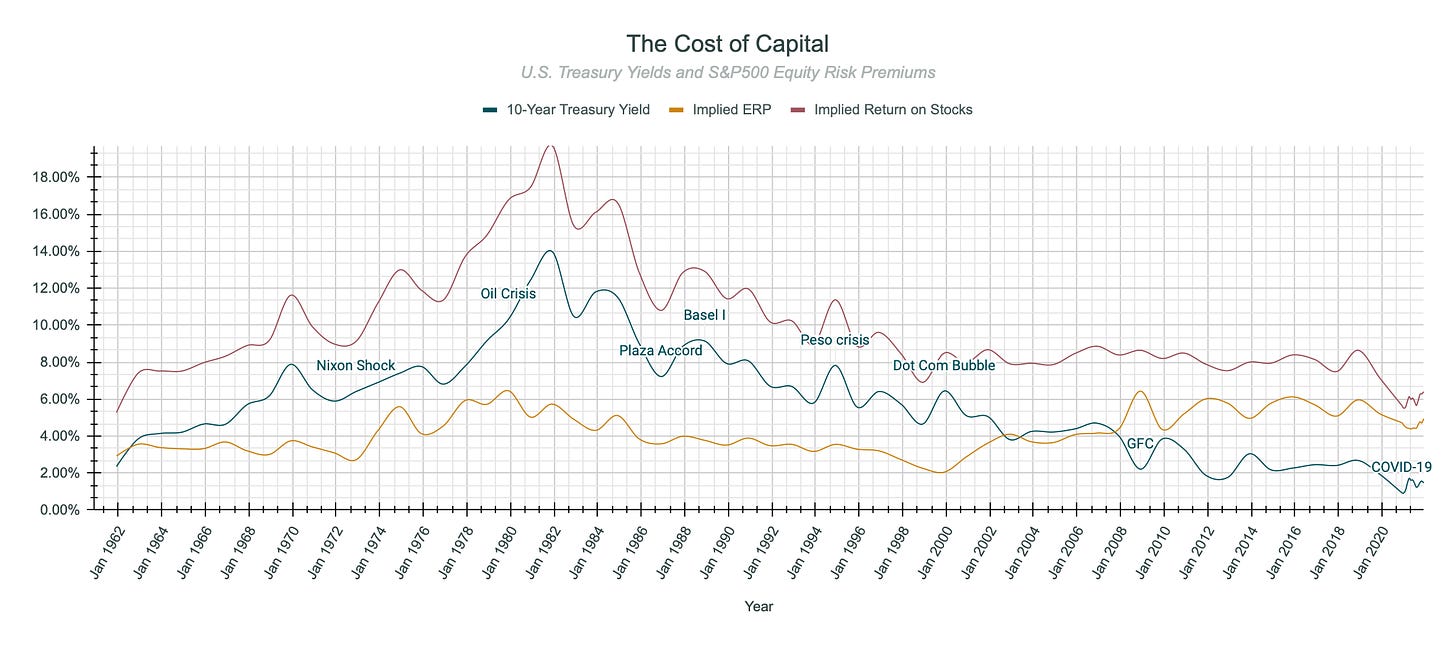
November was an unremarkable month for stocks. The S&P500 finished October at 4,605.4 before closing out November at 4,567.0 for a return of -0.83 per cent.
The 10-Year Treasury yield started the month at 1.56 per cent and finished the month at 1.46 per cent. While my estimate of the Equity Risk Premium (“ERP”) for the S&P500 started the month at 4.72 per cent and finished the month at 4.94 per cent.
The slight decline in the risk-free rate means that investors are now pricing future money as worth slightly more than before. However, they are also pricing equities as being slightly riskier. The net result is that the implied return on U.S. stocks has risen slightly from 6.28 per cent to 6.40 per cent.
But, with the 10-Year Breakeven Inflation Rate remaining around 2.5 per cent, investors are still willing to realise negative (-1.04 per cent) annualised real USD returns.

Finally, using the average ERP of the last five years and the current Treasury Yield, I value the S&P500 at 4,231. This makes it 8 per cent overvalued.
2/ Private Credit and Why Employment Bounced Back
Much has been made of the resilience of the global economy and how quickly it bounced back following the first COVID lockdown. The narrative has increasingly become one of pent up consumer demand, higher savings rates, and underlying business strength. Furthermore, there has been a lot of speculation as to why unemployment has come back so quickly and why, despite the uncertainty of the ongoing pandemic, so many people are changing jobs.
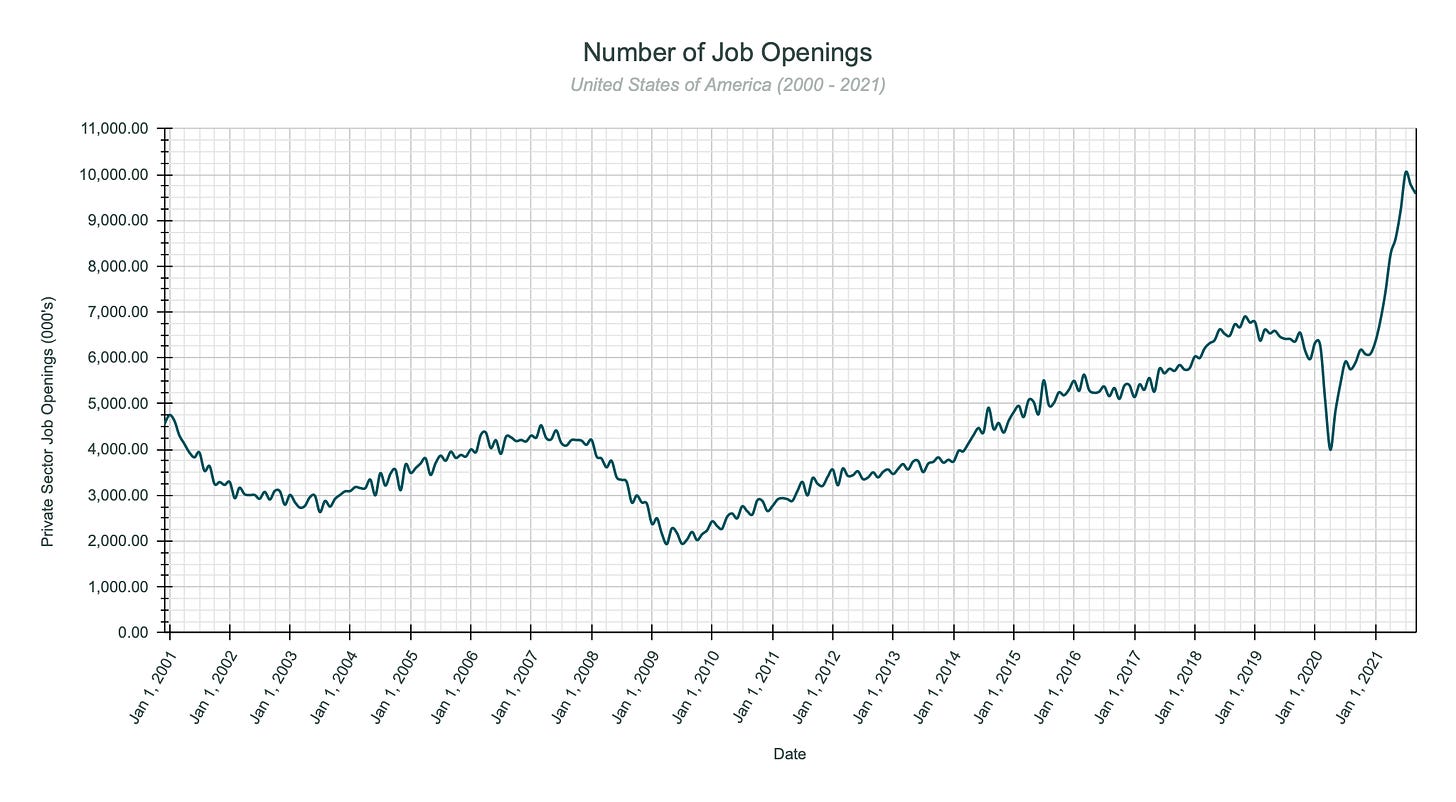
The following chart plots the number of private-sector job openings in the U.S. going back to 2001. We can see that the number of job openings steadily declined following the tech bubble collapse before rising steadily until 2007. The number declined through 2007 and 2008 before bottoming out in April 2009. Then from April 2009 to December 2018, the number rose steadily before beginning to decline again until the number of job openings fell off a cliff as the pandemic lockdowns were rolled out in March 2020. However, since then, the number of job openings absolutely exploded, peaking at over 10 million in July this year before declining slightly. As of September, there are roughly 9.6 million job openings.

What’s going on here? How is it that shortly after one of the most significant economic shocks of the modern age, companies are looking to fill a record number of jobs rather than slowing down and laying people off?
The answer to this lies in what I believe is the most misunderstood driver of the economy: private credit expansion. In essence, private credit is the borrowing capacity of everyone and every non-financial organisation within the private sector. It is the change in debt. If I already owe $100, and I borrow another $10, $10 worth of credit has flowed to me. And, as I have outlined previously, credit expansion creates a self-reinforcing chain of aggregate spending and income increases until financing costs becomes a drag on spending - then the cycle reverses.
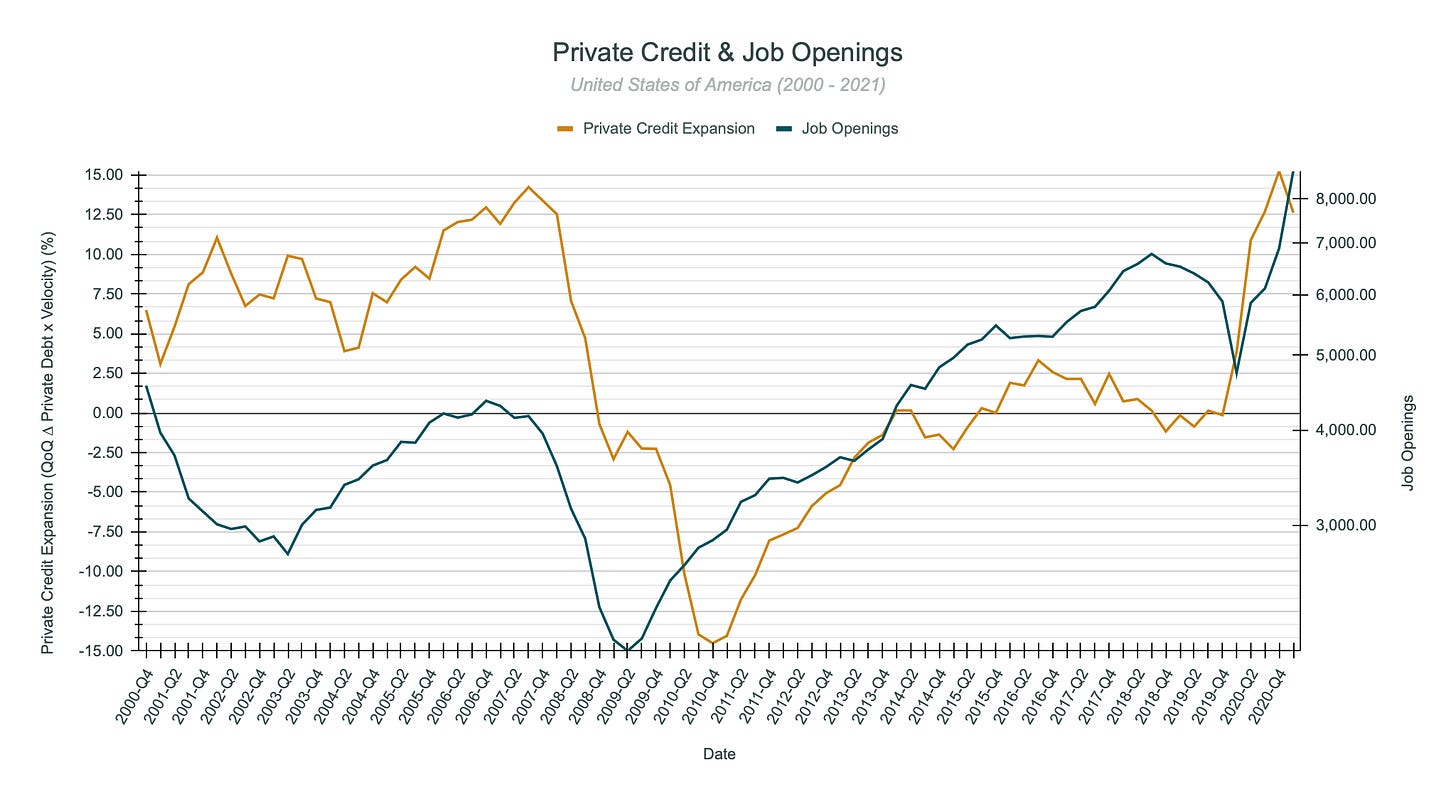
In the following chart, I have plotted the expansion (∆) of private credit as a percentage of GDP (and multiplied by the velocity of money) in the U.S. alongside the number of job openings. From it, we can clearly observe the relationship between them.

In the lead up to the Global Financial Crisis (“GFC”), the number of job openings rose steadily as private credit expanded at a faster and faster rate. Then, as employees were laid off during the recession that ensued, they had less income, couldn’t service their debts or buy as much stuff, and companies began tightening their belts. Credit flows rapidly went into reverse and the number of job openings dried up.
Credit contraction began to decelerate at the end of 2010 and by 2014 the level of private credit was expanding again, and with it the number of job openings. However, private credit levels didn’t really experience another accelerating expansion until the start of the pandemic, when it took off and exploded to its highest level on record (above to previous Q3 2007 peak). And, as to be expected, this led to a dramatic resurgence in the number of job openings.
Moreover, this highlights the cyclical relationship between employment and private credit. They influence and drive each other in cycles. In the following chart, I have plotted the private credit expansion against the unemployment level for the United States.

Of course, the economists among us will realise that this is starting to suspiciously resemble some sort of adjusted Phillip’s Curve - the statistical correlation between unemployment and inflation named after William Phillips and expanded upon by Milton Friedman and Edmund Phelps. And, in a once-removed sort of way you are correct. In fact, since 1977, the Federal Reserve has operated with the mandate of maximising employment by targeting moderate and stable inflation and attempting to directly influence the expansion of private sector credit by controlling the prevailing interest rate.
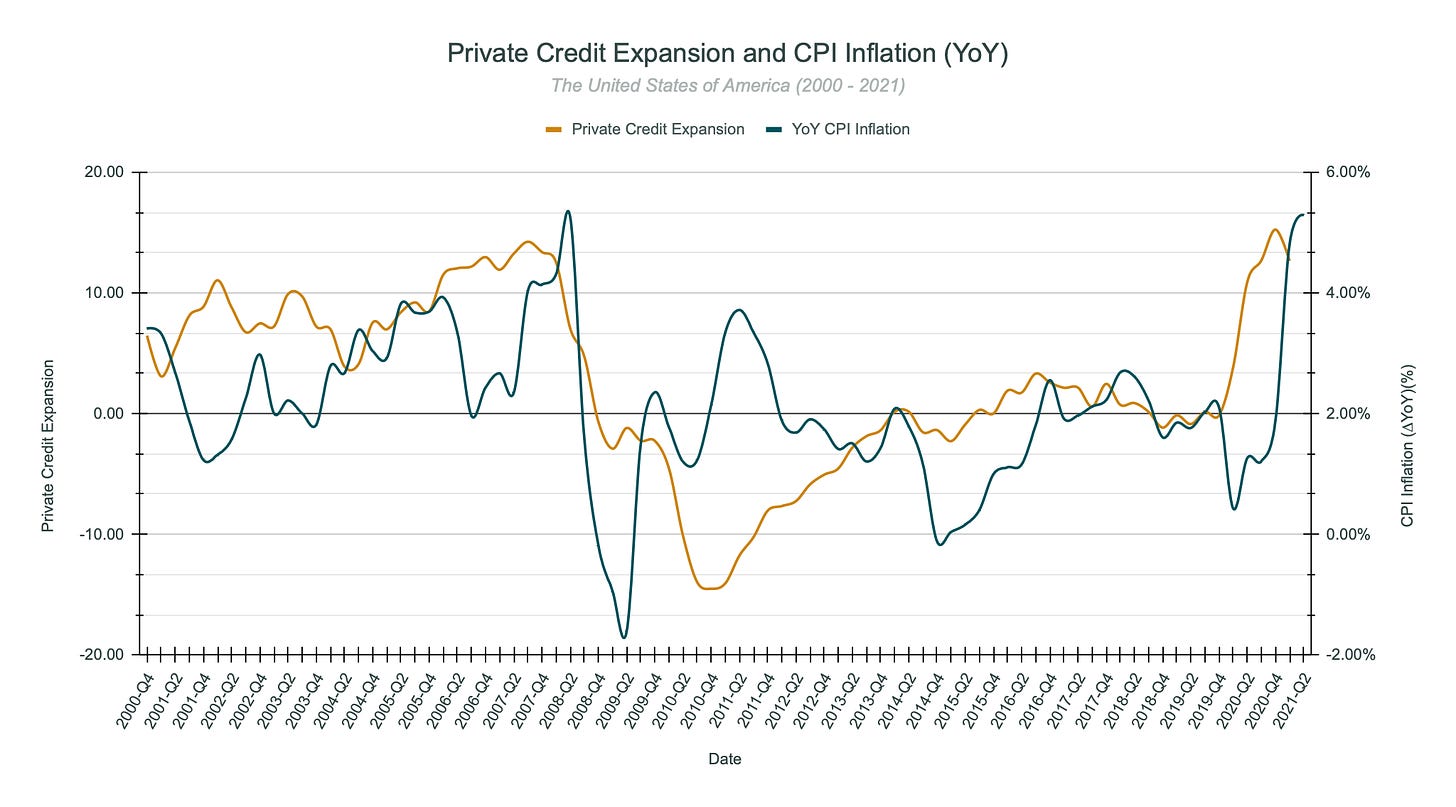
Moreover, inflation is a direct result of private credit expansion. And, if you had been watching the levels of private credit expansion throughout last year and this, you would have realised that inflation was on its way.

So, what does this mean for the future?
Inflation will remain high so long as private credit continues to expand rapidly. Job openings, wages, income and spending will all rise, and it will feed on itself.
However, if inflation causes nominal rates to rise, private credit expansion will slow and potentially reverse. Job openings will decline, unemployment will rise and incomes and spending will drop.
This is the inflation-deflation tightrope that central bankers must walk.
I first posted a summarised version of this research as a Twitter thread. Follow me there to get timely research and commentary, and to interact with me.

3/ Stock Valuation Rundowns
Tupperware Brands Corporation (NYSE: TUP) - Valuation on December 3, 2021
Tupperware Brands Corporation ($779 million market cap) is the namesake of reusable food storage. A tough decade of declining sales was capped off by a horrible 2020 in which the company almost collapsed under the crushing weight of its debt burden. However, they righted the ship, managed to survive, and have paid down about $250 million since.
The company is a sizable (8 per cent market share) player in the global reusable food container market. This market is growing at 4 per cent per annum, and economists expect it to be worth $28 billion by 2026. However, Tupperware is a declining portion of this market because of its failure to generate a meaningful presence outside of its MLM salesforce. A turnaround is in place, but it will take time, and I expect that the company will continue losing market share at a similar pace until it is left with about 6 per cent in 2026. By continuing to consolidate (selling the beauty businesses and excess land holdings), the company will be able to focus on operational efficiency and expanding its retail and online presence. With these in place, the company can leverage its branding to pass through cost inflation and keep margins in line with theirs and the industries decade-long average.
Finally, I have treated the company's promotional and distribution costs as variable costs, decreasing their operational leverage. But, the effect of their still large debt burden (103 per cent Debt/Market Cap) is to drive the cost of equity much higher, give them a lousy B1/B+ credit rating, and drive a significant (20.6 per cent) chance of distress. Oh, they also have a $137 million hole in their pension and post-retirement benefit obligation pots.
I have valued the business in USD.
Intrinsic value per share: $26.85
Price per share: $15.27
Price-to-value: 57%
Monte-Carlo percentile: 10%
Rating: Buy
Despite my downbeat story for the business, the shares are still undervalued in 90 per cent of scenarios I modelled. I am adding a small position to my portfolio because the shares slightly improve my portfolio’s expected return while reducing my risk.


